If you’ve ever clicked on a website and waited several seconds for something—anything—to appear on screen, you know exactly how frustrating slow server response time can be. That delay, often invisible to the untrained eye, is your server taking too long to process the request and start sending data back to the browser. And here’s the thing: even a difference of a few hundred milliseconds can mean the difference between a visitor staying on your site or hitting the back button.
Server response time, sometimes called Time to First Byte (TTFB), is the duration between a user’s browser requesting a page and receiving the first byte of data from your server. It’s one of the most critical performance metrics for any website, yet it’s often overlooked until problems become obvious. In this article, I’ll walk you through what constitutes good server response time, why it matters, and practical steps you can take to optimize it.
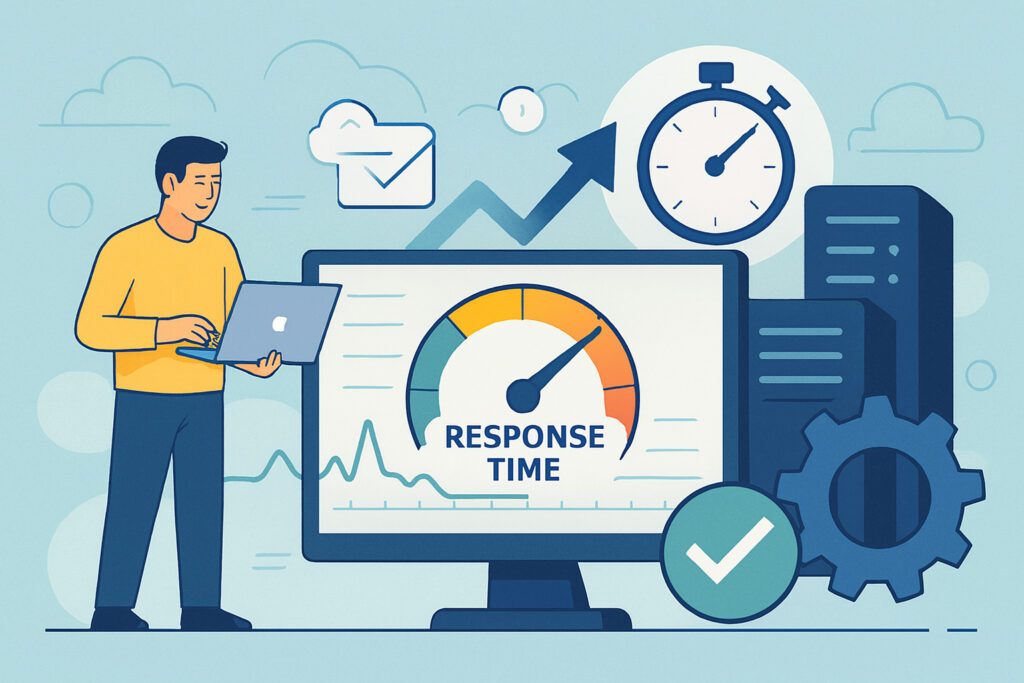
What Is Considered Good Server Response Time?
Google recommends keeping server response time under 200 milliseconds. In practice, anything under 300ms is generally acceptable for most websites, while 500ms or higher starts to noticeably impact user experience and search rankings. High-performance sites often achieve response times well under 100ms, but this typically requires significant optimization and infrastructure investment.
The benchmark you should aim for depends on your site’s complexity and purpose. A simple blog can easily hit 100-150ms, while a complex e-commerce platform with database queries, user sessions, and dynamic content might reasonably target 200-400ms. The key is understanding where you currently stand and systematically improving from there.
Why Server Response Time Matters
Slow server response time doesn’t just frustrate users—it directly impacts your business metrics. Studies consistently show that every 100ms of delay can reduce conversion rates by 1-2%. Search engines like Google also factor server speed into rankings, meaning slow response times can hurt your visibility.
I learned this the hard way a few years back when running a monitoring service. We had solid uptime, but some customers complained about occasional slowness. After investigating, I discovered our server response time would spike to 800-1200ms during peak hours. The database was the culprit—poorly optimized queries were stacking up. Once we addressed it, response times dropped to 150-200ms consistently, and customer complaints virtually disappeared.
Common Causes of Slow Server Response Time
Understanding what slows down your server is the first step to fixing it. Here are the most frequent culprits:
Database queries are often the biggest bottleneck. Unoptimized queries, missing indexes, or simply too many queries per page load can add hundreds of milliseconds to response time.
Server resources matter enormously. Insufficient RAM forces your server to use slower disk swap space. CPU limitations prevent efficient request processing. Network congestion or bandwidth restrictions add latency.
Application code inefficiency means your scripts are doing unnecessary work—loading files multiple times, performing redundant calculations, or using bloated frameworks without optimization.
External API calls can introduce unpredictable delays. If your page loads data from third-party services, you’re at the mercy of their response times.
Server location affects latency based on physical distance between server and user. A server in Frankfurt serving users in Tokyo will inherently have higher response times than one in Tokyo.
Step-by-Step Optimization Tips
Measure first, optimize second. Use tools like WebPageTest, GTmetrix, or Pingdom to establish your baseline server response time. Check from multiple geographic locations if you serve a global audience. My monitoring service UptimeVigil measures response times every minute, which helps spot patterns and anomalies quickly.
Enable server-level caching. For WordPress sites on Debian servers (my preferred setup), I always install and configure OPcache for PHP. This alone can reduce response time by 30-50% by caching compiled PHP code in memory. Configure it properly in php.ini with adequate memory allocation—at least 128MB for most sites.
Optimize your database. Run queries through EXPLAIN to identify slow operations. Add indexes to frequently queried columns. For WordPress, plugins like Query Monitor help identify problematic database queries. I once reduced a client’s TTFB from 650ms to 180ms just by adding three strategic database indexes.
Implement object caching. Redis or Memcached can dramatically reduce database load by caching query results. For WordPress, pair this with a plugin like Redis Object Cache. The first-time setup takes maybe 30 minutes on a Debian server, but the performance gains are substantial and permanent.
Upgrade server resources strategically. More RAM is often more valuable than more CPU cores for typical web applications. If you’re running a VPS with 1GB RAM, upgrading to 2-4GB usually provides noticeable improvement. Monitor actual resource usage before upgrading—don’t guess.
Minimize external dependencies. Review all external API calls and third-party scripts. Can they load asynchronously? Can you cache results locally? Every external dependency is a potential point of failure and delay.
Use a Content Delivery Network (CDN). While CDNs primarily accelerate static content delivery, many also offer dynamic content acceleration that can reduce server response time for users far from your origin server.
Common Misconceptions About Server Response Time
Many people confuse server response time with total page load time. These are different metrics. TTFB measures how quickly your server responds; total load time includes downloading all resources and rendering the page. You can have fast TTFB but slow overall loading due to large images or unoptimized JavaScript.
Another myth: ”Shared hosting is always slow.” While dedicated resources generally perform better, a well-optimized site on quality shared hosting can outperform a poorly configured VPS. I’ve seen it repeatedly—optimization matters more than raw server specs up to a point.
Monitoring and Maintaining Performance
Server response time isn’t a ”set it and forget it” metric. Traffic patterns change, databases grow, and code accumulates technical debt. Set up continuous monitoring to alert you when response times degrade. Automated monitoring every few minutes helps catch issues before they impact users significantly.
Review your server response metrics monthly. Look for trends—is TTFB gradually increasing? That suggests growing database size, traffic increases, or accumulated inefficiencies that need attention.
When you make optimization changes, measure before and after. Document what you changed and the results. This creates a knowledge base for future optimization work and helps you understand what actually moves the needle for your specific setup.
Frequently Asked Questions
Is 500ms server response time acceptable? It’s borderline. Users might not consciously notice it, but it’s affecting your metrics. Aim for under 300ms if possible.
Will upgrading to a faster server automatically improve response time? Not necessarily. If your bottleneck is database queries or inefficient code, more server power just runs inefficient operations faster. Optimize first, then upgrade if needed.
How often should I check server response time? Continuous monitoring is ideal, but at minimum, check weekly and after any significant site changes or traffic increases.
Server response time optimization is an ongoing process, not a one-time fix. Start with the basics—caching, database optimization, adequate resources—and progressively refine from there. The investment in faster response times pays dividends in user satisfaction, conversion rates, and search visibility.