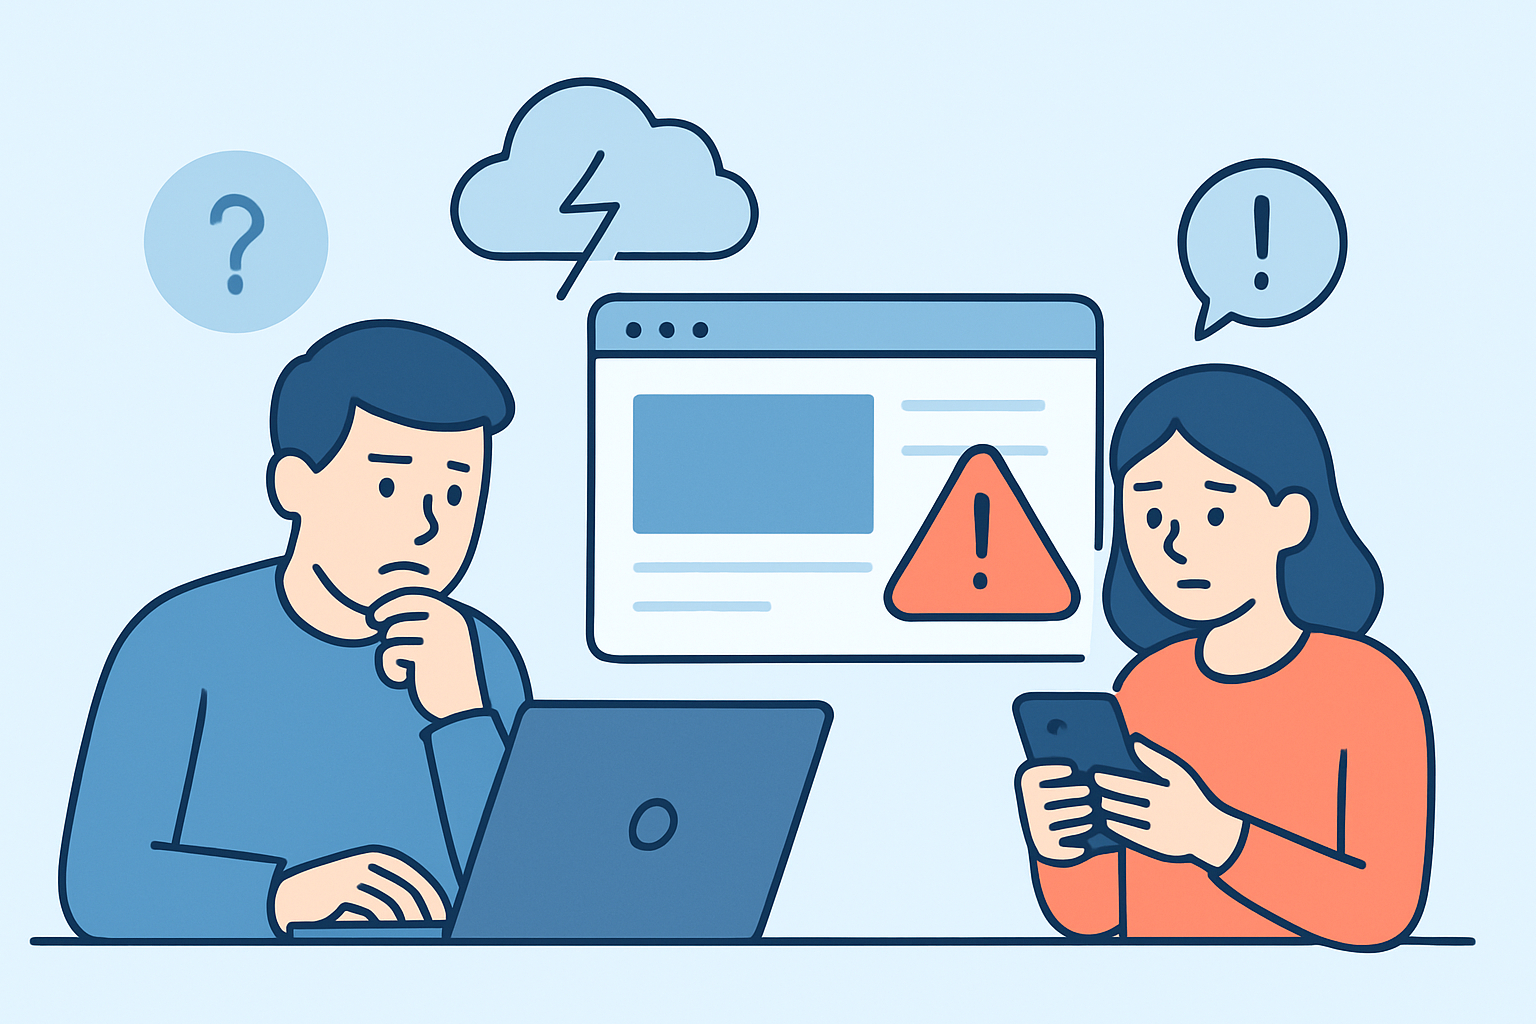
Partial outages are some of the hardest problems in web operations to catch, because the site looks fine to you while a meaningful slice of your visitors are staring at errors, timeouts, or broken checkouts. Detecting partial outages that only affect some users requires a different approach than standard uptime monitoring, since a single check from a single location will often report everything as healthy even while real customers are locked out.
Why Partial Outages Slip Past Standard Monitoring
Most monitoring setups run a single check against a single endpoint from a single region, then call it a day. That works fine for a full outage – the server is down, everyone gets an alert, everyone reacts.
The trouble starts when the failure is conditional. A load balancer might be routing 20% of traffic to a misconfigured backend node. A CDN edge in one region might be serving stale or broken content while every other edge works perfectly. A database read replica in one availability zone might be lagging or unreachable, breaking requests only for the users whose session happens to land there.
In every one of these cases, a monitor checking from one vantage point can come back green for hours while a real segment of your audience gets 500 errors or blank pages.
Common Causes Behind User-Specific Failures
A handful of root causes show up again and again when teams dig into partial outages after the fact.
Load balancer misrouting is one of the most frequent. When a new server joins a pool with a bad deploy or missing environment variable, only requests routed to that node fail, while the rest of the pool answers normally.
DNS propagation delays cause a similar pattern. After a DNS change, some resolvers and ISPs pick up the new record within minutes, others cache the old one for hours, so users are effectively split between the old and new infrastructure during the transition.
CDN and edge node issues follow the same logic – a single point of presence having trouble means users geographically close to that node see failures while everyone else is unaffected.
Feature flags and A/B tests can also be the culprit. A flag rolled out to 10% of sessions with a bug in the new code path will only ever break things for that 10%, which makes it look like a random, hard-to-reproduce issue.
Finally, third-party integrations – payment processors, authentication providers, embedded widgets – can degrade for a subset of requests depending on which upstream instance handles the call, which is worth checking closely if you rely on external services (see monitoring third-party dependencies and integrations for more on that risk).
Practical Steps to Detect These Failures
Detecting a partial outage means building monitoring that mimics the diversity of your actual user base, rather than a single idealized request.
Start by monitoring from multiple geographic locations rather than one. If a check from Frankfurt succeeds but a check from Singapore fails, that difference is the whole signal – a single-location check would never surface it. This is exactly the gap that multi-location monitoring is built to close, and it’s worth understanding how geographic location affects website availability before assuming your infrastructure behaves identically everywhere.
Next, monitor specific user flows, not just the homepage. Login, checkout, search, and account pages each touch different backend services and can fail independently of the main site. A homepage returning 200 tells you almost nothing about whether a payment actually goes through.
Watch response time variance, not just uptime status. A server quietly serving slow responses to a subset of requests – say, one node in a cluster running out of memory – often shows up as elevated latency long before it produces outright errors. A sudden spike in the 95th percentile response time while the average stays normal is a strong sign that a smaller group of users is having a much worse experience than everyone else.
Cross-reference monitoring alerts with real user reports and support tickets. If two or three customers mention “the site won’t load for me” within the same hour, that pattern is worth investigating even if every automated check is green – it often means the sample size of your monitoring checks is too small to catch the affected segment.
Set up monitors against individual backend nodes where possible, not just the public-facing load balancer endpoint. This isolates whether a problem is systemic or confined to one piece of infrastructure.
Busting the “If My Monitor Is Green, Everything Is Fine” Myth
A common misconception is that a passing uptime check means the site is fully operational. In reality, a single check only proves that one request, from one location, to one endpoint, succeeded at one moment in time.
Partial outages exist precisely in the gap between what a narrow check measures and what your actual users experience. Broader monitoring – multiple locations, multiple pages, multiple types of checks – doesn’t just catch more problems, it closes that gap and gives a far more honest picture of availability than a single green dot ever could.
Building a Response Plan for Partial Outages
Once detection improves, response needs to keep pace. Partial outages are often dismissed early because they don’t match the mental model of “the site is down or it isn’t.”
Treat a repeated pattern of geography-specific or flow-specific failures with the same urgency as a full outage, even if the majority of checks are passing. Document which segment is affected – region, device type, user flow – as soon as it’s identified, since that detail speeds up root cause analysis enormously. And once resolved, run through what allowed the issue to stay undetected for as long as it did, so the next partial failure gets caught sooner.
Frequently Asked Questions
How is a partial outage different from a full outage?
A full outage means the entire site or service is unreachable for essentially all visitors. A partial outage affects only a subset of users, often based on their location, the specific page or feature they’re using, or which backend server handles their request, while the rest of the site continues functioning normally.
Can uptime monitoring alone catch partial outages?
Basic single-location uptime checks often miss partial outages entirely, since they only test one path to the server. Monitoring from several geographic locations, checking multiple pages and user flows, and watching for latency anomalies gives a much more realistic view of what different user segments are actually experiencing.
What is usually the fastest way to confirm a partial outage is happening?
Comparing results across monitoring locations is typically the quickest signal – if checks from some regions succeed while others fail or time out, that discrepancy on its own confirms the outage is partial rather than global, and points directly at where to start investigating.
Partial outages rarely announce themselves with a dramatic full-site crash – they show up as a slow trickle of complaints, a strange latency graph, or a handful of failed transactions that don’t fit any obvious pattern. Building monitoring that checks from multiple locations, covers real user flows, and tracks response time distribution rather than just up-or-down status is the most reliable way to catch these issues before they turn into a much larger, much more visible problem.